
Finance professionals are often in a unique position to be able to identify and respond to risk in a different way than line operating managers. One of the tools I’ve found to be useful is a heat map. There are many different ways to think of risk, but what follows is an example of what I found to be particularly useful to keep the company (and myself!) out of trouble, while managing the financial matters in an organization with well over 1,000 employees and a billion dollars of revenue.
In a prior life, I was tasked with a senior finance role in a large, international manufacturer and distributor. Among other things, I was broadly responsible for controllership, financial reporting and analysis, and decision support of the operations.
The role required a breadth of business understanding across a variety of products, markets, geographies, paths to market, and industries and included substantial supervisory responsibilities as well.
To be effective, I needed to think of both upside and downside. The upside was pretty standard fare. That is, helping operational managers identify pockets of revenue, margin, or cost opportunity was a relatively simple matter of walking them through historical financial statements, and asking lots of questions. Guarding against the future downside risk, however, was much more challenging.
How could I proactively identify areas of risk before events with negative consequence occurred?
Following the realization of the magnitude of the challenge, there were sleepless nights, and a constant sinking feeling in the pit of my stomach. Every day, I asked myself from what corner of the globe would the next “OMG moment” come?
I wrestled with this for a long time, and came up with the idea of how to visualize business risk to the business’s individual operating locations.
Before I explain the tool I developed, it’s important to understand the structure of this distributed operating business. Similar products were sold from nearly 50 bricks and mortar locations across the United States and South America. Each operating location was led by a branch manager, who had full P&L responsibility for their own operations, including revenue, supervisory human resources management, inventory control, collections of problem receivables, and the like.
Further, I quickly observed that risk could best be understood, identified, and managed through people. These branch managers, more than anyone else, held the critical relationships with customers and line employees and had line of sight to every transaction the business entered into. In short, they were standalone business operators, working under a corporate umbrella of support with a set of standards and expectations.
By socializing with my peers, I also got to learn a host of institutional stories about all manner of things that had gone wrong in the past, and witnessed the discovery and resolution of plenty of new problems as well. I reflected on these, and wondered how they could best be quantified, and future occurrences predicted.
As a finance leader, how could my department be of value to the organization and help both the branch managers both spot and avoid problems before they occur?
So, I set out a blank piece of paper and jotted down all the drivers of control risk. I identified several:
The Factors
- Branch size: The larger the branch (measured in revenue), the more opportunity for something to go wrong.
- Performance to budget: The worse the performance to budget, the more likely the manager is incentivized to take on more risk to try and achieve profitability-based financial incentives.
- Employee turnover: High employee turnover is an indicator that something is amiss with operations, markets, and/or management.
- Other: I left another category open for a host of other more subjective items. For instance:
- A branch location in Venezuela had a cadre of risks that were literally foreign to the rest of the business.
- Locations near concentrations of troubled industries should be tagged with elevated risk.
- General branch culture that was more entrepreneurial introduced higher levels of risk of noncompliance with corporate controls.
- Branch managers that were new to their management role were unproven as to their level of skill.
Then, I jotted down a list of all 50 branch locations in Excel, and got about the business of assigning numbers to each of these factors. I multiplied them across, and came up with an Enterprise Control Risk Factor (the ECRF) for each location.
Great! This feels like progress. Now, what!?
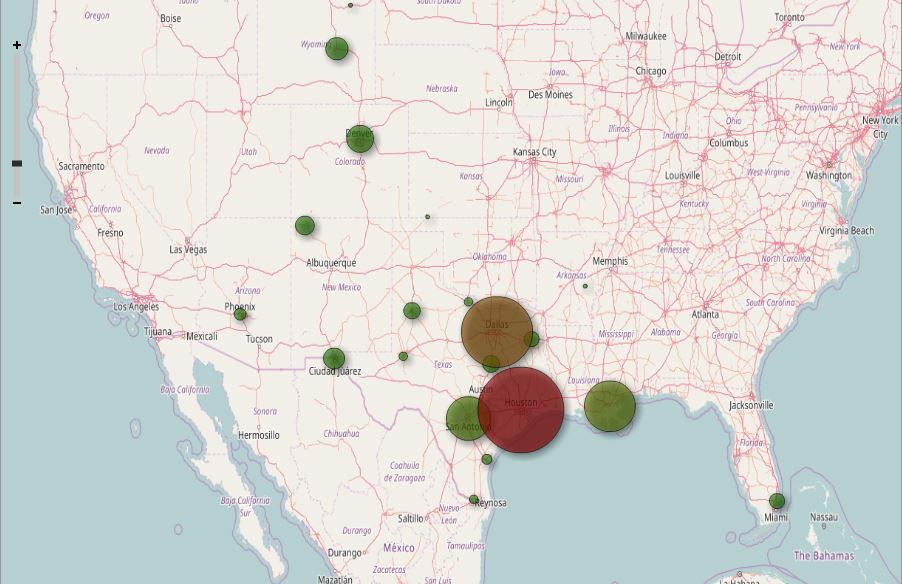
Well, I had a list of locations with geography, and I had a number. How about dropping this all on a map?

Each branch location’s circle size is representative of the size of the Enterprise Control Risk Factor.
Well, that looks pretty… but what to do with it?
Well, the job of the finance guy is to be keenly aware of the operations and to support the operational managers in any way possible.
So, how to keep everyone out of trouble?
Work the map! Focusing on the bigger circles or those with a size that had increased versus the last period, I would find a reason to pick up the phone and call each branch manager on a regular basis. Leveraging my knowledge of daily operations, the reason could be as simple as checking in on how the financial results for the month were coming. How are they feeling about meeting budget this month or this quarter? How is the new employee working out? Is the new software working out and fulfilling its promise? The problem customer relationship from last quarter… what will it take for them to buy from us again? All of those questions are rooted in issues that the branch manager is experiencing on a daily basis, so it’s important to be relevant to their lives.
Of course, asking such questions requires earning the right to be helpful, and the price of poker is having already established trusted relationships, but that’s a topic for another, future article.
With this tool and framework from which to think about risk to the enterprise at the branch level, both the sleepless nights and the sinking feeling abated.
(Pro tip: You can easily create your own heat map using the free tool OpenHeatMap.)

I like this article, it combines a number of different business approaches into a systematic approach. The result would be much better than any one approach.
LikeLike